Behaviour of solid substances under the influence of large deforming forces:
It may be pointed out that the same substance may show different types of behaviour depending upon its physical condition under the influence of the applied force.
Take a steel wire and go on stretching it. A limit is reached beyond which, even if the applied force is removed, the wire does not regain its original shape and size. This limit is known as an elastic limit. An elastic limit is defined as the limit beyond which a solid substance behaves as a plastic substance and the body does not recover its original shape and size after the external deforming forces cease to act on it. The steel wire in the above case, beyond the elastic limit, behaves like a plastic body. In other words, the same substance may behave like an elastic or plastic substance under different conditions. Thus, an elastic body will behave as a plastic body beyond the elastic limit.
After the elastic limit, a point is reached when the body or substance gets deformed under the effect of its own weight. Under such conditions, the body is said to flow. Example- wet flour. This point after which the solid substance flows is referred to as yield point. The metallic rods can be drawn into wires and the metals under such conditions are said to be ductile in nature.
Different solid bodies may behave differently under the influence of external deforming forces. For instance, a ball of mud when dried and pressed, breaks into pieces. It is said to be brittle in nature. The yield point obtained under compression is referred to as crushing point. The metals after this point are said to be malleable, in nature. For instance, the metals like copper and silver can be hammered or rolled into sheets.
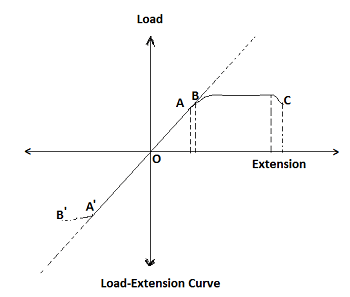
The behaviour of a solid substance under the influence of the applied force can be studied with the help of load-extension curve. This is shown in the fig.

The load extension curve for a solid substance gives us very important information about the elastic behaviour of the substance. It is evident from the figure that-
- The graph from O to A or O to A‘ is a straight line. This region is referred to as a linear region. In this region, the load is proportional to the extension.
- The points A and A‘ on the load-extension curve represent the elastic limits. The points B and B‘ are known as yield point and breaking point, respectively.
- After point B, the substances will exhibit the property of ductility (i.e. it can be drawn into wires). After point B‘, the substance will show the property of malleability (i.e. it can be rolled into sheets).
- From point B to C, is a region of plasticity (i.e. the substance will not regain its original shape and size even after the removal of the applied force).
Different solid substances will have different types of load-extension curves. The above cited points will always be somewhere on the load-extension curves. The relative positions of the points will be different for different substances.


Comments (No)