Table of Contents
What is Ecological Pyramid?
Ecological pyramids are the graphic representation of various ecological parameters at the successive trophic levels of food chains with producers at the base, top carnivores at the apex, and intermediate levels in between.
Quantity at each level is indicated by the length of the bar in the graph. The pyramids are, therefore, also called bar diagrams.
Ecological pyramids were first prepared by Elton (1927). Hence they are also called Eltonian pyramids.
Types of Ecological Pyramids:
Pyramid of Numbers:
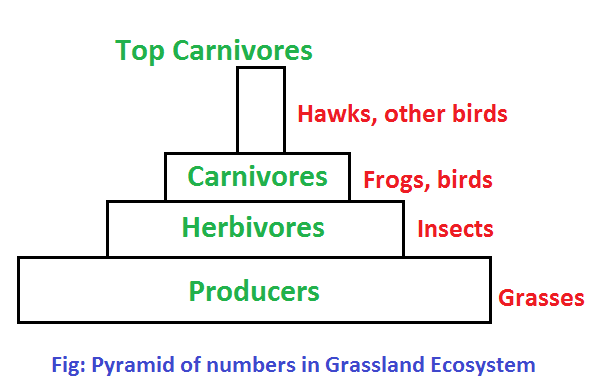
It represents the number of individual organisms at each trophic level. We may have an upright or inverted pyramid of numbers, depending upon the type of ecosystem and food chain. A grassland ecosystem and a pond ecosystem show an upright pyramid of numbers. The producers in the grasslands are grasses and that in a pond are phytoplanktons (algae etc.), which are small in size and very large in number. So the producers form a broad base. The herbivores in grassland are insects while tertiary carnivores are hawks or other birds which are gradually less and less in number and hence the pyramid apex becomes gradually narrower forming an upright pyramid. Similar is the case with the herbivores, carnivores, and top carnivores in the pond which decrease in number at higher trophic levels.
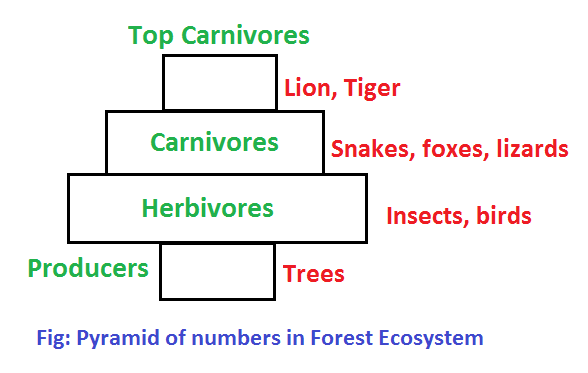
In a forest ecosystem, big trees are the producers, which are less in number and hence form a narrow base. A larger number of herbivores including birds, insects, and several species of animals feed upon the trees (on leaves, fruits, flowers, bark, etc.) and form a much broader middle level. The secondary consumers like a fox, snakes, lizards, etc. are less in number than herbivores while top carnivores like lion, tiger, etc. are still smaller in number. So the pyramid is narrow on both sides and broader in the middle.
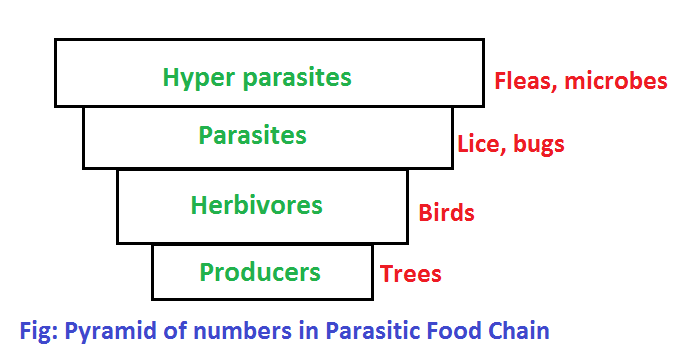
The parasitic food chain shows an inverted pyramid of numbers. The producers like a few big trees harbour fruit-eating birds acting like herbivores which are larger in number. A much higher number of lice, bugs, etc. grow as parasites on these birds while a still greater number of hyperparasites like bugs, fleas, and microbes feed upon them, thus making an inverted pyramid.
Pyramid of Biomass:
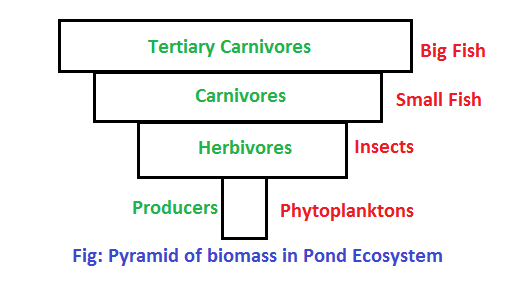
Biomass is a renewable organic (living) material. A pyramid of biomass is a representation of the amount of energy contained in biomass, at different trophic levels for a particular time. It is measured in grams per meter2, or calories per meter2. This demonstrates the amount of matter lost between trophic levels. Each level is dependent on its lower level for energy, hence the lower level determines how much energy will be available to the upper level. Also, energy is lost in the transfer so the amount of energy is less higher up the Pyramid.
There are two types of biomass pyramids: upright and inverted.
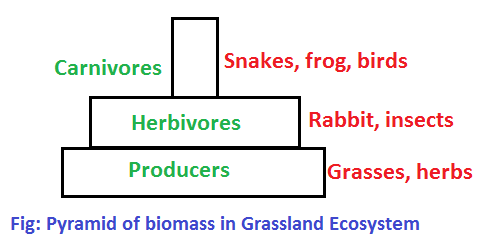
An upright pyramid is one where the combined weight of producers is larger than the combined weight of consumers. An example is a forest and Grassland ecosystem.
An inverted pyramid is one where the combined weight of producers is smaller than the combined weight of consumers. An example is an aquatic ecosystem.
Pyramid of Energy:
The pyramid of energy represents the total amount of energy consumed by each trophic level. An energy pyramid is always upright as the total amount of energy available for utilization in the layers above is less than the energy available in the lower levels. This happens because, during energy transfer from lower to higher levels, some energy is always lost.
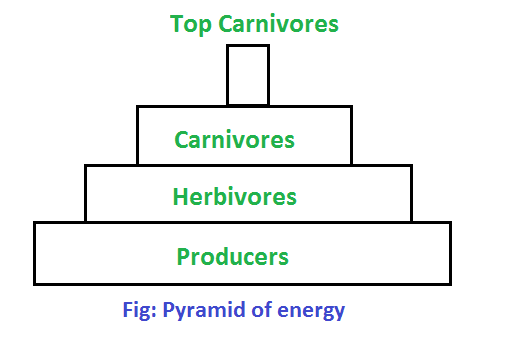
No organism ever collects 100 percent of the energy stored in the plant or animal it eats, however. An ecological pyramid makes clear two important facts about food webs. First, as pointed out previously, the total amount of energy at any one level decreases as one goes up the pyramid. That is, the producer level contains the greatest amount of energy, the first-order consumer level the next largest amount, the second-order-consumer level the next largest amount, and so on. Second, the total number of organisms found in any one level also decreases in going up the pyramid. An ecosystem that contains 10,000 lettuce plants may be able to support no more than 100 rabbits, 10 owls, and 1 hawk, as an example.
Limitations of Ecological Pyramids:
- Pyramids do not include decomposers though a major part of energy passes through them.
- They have no remedy for multi-level organisms.
- There is no provision for seasonal, diurnal and other variations.


Comments (No)