Table of Contents
What is Photoelectric Effect?
It is the phenomenon of emission of electrons from the metal surface when light radiations of suitable frequency fall on them. The emitted electrons are called Photo-electrons and the current so produced is called Photoelectric current. Alkali metals like lithium, sodium, potassium show the photoelectric effect when visible light falls on them whereas metals like zinc, magnesium etc show a photoelectric effect when u.v. light falls on them.
Experimental Study of Photoelectric Effect:
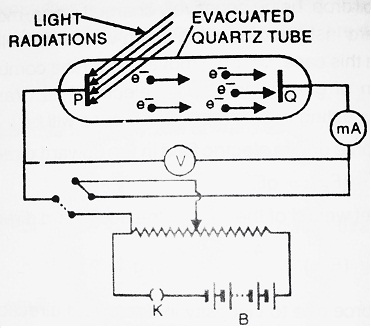
The apparatus consists of an evacuated quartz tube in which two plates P and Q called as cathode and anode are fitted. The plate Q can be given a desired positive or negative potential, using the arrangement as shown.
Voltmeter V, measures the potential difference between the plates P and Q whereas milliammeter (mA) measures the photoelectric current in the circuit.
When light rays of suitable frequency fall on plate P, the photoelectrons are emitted. If the plate Q is kept at a positive potential, then these electrons get accelerated towards plate Q and hence, photoelectric current flows through the circuit.
Effect of Intensity of Incident Light:
Give the plate Q, some definite positive potential. Allow the light of some intensity to fall on plate P. Due to this, photoelectrons are emitted. These emitted photoelectrons travel towards plate Q and hence photoelectric current flows through the circuit.
If we increase the intensity of incident light falling on plate P, we note that photoelectric current also increases and so on. When we draw a graph between the intensity of incident light and photoelectric current, we get a straight line as shown in the figure.
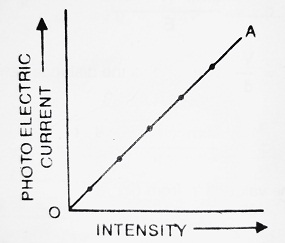
Conclusion- The number of photoelectrons emitted per second from plate (P) is directly proportional to the intensity of incident light.
Effect of Potential:
Allow the light of some fixed intensity (Say I1) to fall on plate P. When the potential of plate Q is 0 volts, a little current equal to OK flows through the circuit. Now, when the potential of plate Q is made positive, the photoelectric current increases till it reaches a maximum value. This maximum value of current is called saturation current. When the potential of plate Q is made negative, the photoelectric current decreases sharply to zero.
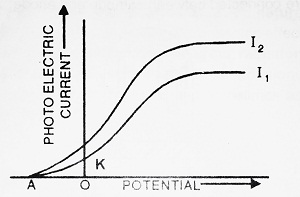
This potential at which the photoelectric current becomes zero is called stopping potential (V0). Hence stopping potential is defined as the minimum negative potential of plate Q, at which photoelectric current becomes zero. It is also called cut-off potential.
If the experiment is repeated with incident light of higher intensity, say I2, then we note that the value of saturation current is more whereas stopping potential remains same. Thus we can conclude that stopping potential does not depend upon the intensity of incident light. Also, if m be the mass of photoelectron and ν’max be its maximum velocity then,
Maximum Kinetic Energy of Photoelectron = (1/2) mν’2max ……….(i)
If e be the charge and V0 be the stopping potential of the photoelectron, then, work done to stop the photoelectron = eV0 ……….(ii)
From (i) and (ii),
| (1/2) mν’2max = eV0 |
Thus, we can also conclude that the maximum velocity of emitted photoelectrons does not depend upon the intensity of incident light.
Effect of Frequency:
(a) Allow the light of some fixed intensity and of different frequencies to fall on plate P. Now, draw the graph between photoelectric current and potential of plate Q. We get the graph as shown in the figure.
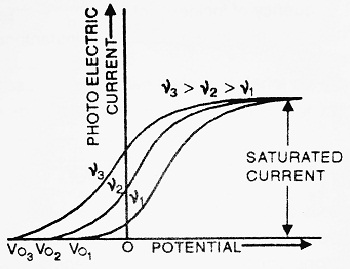
From the graph, we note that, when we increase the frequency of incident light, the saturation current always remains the same whereas the stopping potential increases. Thus we conclude that the maximum velocity of emitted photoelectrons depends upon the frequency of incident light.
(b) If we plot the graph between stopping potential and frequency, we get a straight line as shown in the figure.
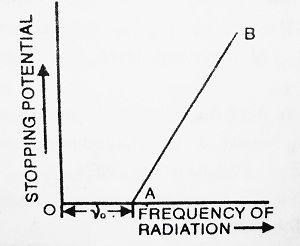
From the graph, it is clear that there is a certain minimum value of frequency (ν0) below which no photoelectric emission is possible. This minimum value of frequency is called Threshold frequency.
In these experiments, it is found that, if incident light has a frequency greater than the threshold frequency, then photoelectric emission starts instantaneously.
Laws of Photoelectric Effect:
On the basis of experimental studies, the following laws have been obtained for the photo-emissions of electrons.
- For a given metal, the number of photoelectrons emitted per second is directly proportional to the intensity of incident light.
- For a given metal, there is a certain minimum value of frequency, below which no photoelectric emission is possible. This frequency is called threshold frequency.
- Above the threshold frequency, the maximum kinetic energy of emitted photoelectron is independent of the intensity of incident light but depends upon the frequency of incident light.
- The photoelectric emission is an instantaneous process.







Comments (No)