Table of Contents
Mastering Critical Values: A Simple Guide
The critical value is based on the significance level and degrees of freedom of the sampling distribution. It depends on the type of distribution you are analyzing. In statistics, a critical value is a specific point or threshold value at which a researcher and analysts decide whether to reject or accept the null hypothesis in hypothesis testing.
The choice of critical values depends on the distribution of the test statistics. The types of the tests i.e. t-value test and z-value test. For example, in a z-value test with a 5% significance level, you might use the critical values ± 1.96 for the two-tailed test.
In this article, we are going to discuss the idea of the critical value of statistics. We will learn how to calculate critical values using different methods step-by-step and clarify critical values by solving some examples.
What is a critical value?
A critical value is a value that separates the rejection region from the acceptance region in a statistical hypothesis test. The test statistic will exceed the critical value less likely to occur if the null hypothesis is true. Therefore, if the test statistic exceeds these cutoffs, you can reject the null value and conclude that the effect rises in the population.
In other words, it defines the range of rejection of the null hypothesis. The following table is the table distribution to find the critical point.
Hypothesis Testing to Find Critical Value:
Hypothesis testing is a powerful way in statistics, usually used in a of fields to make inferences about population parameters, informed decisions and draw reliable conclusions from limited sample data. It’s denoted as the letter z and the formula:

- x is the sample mean
- μ is the population mean
- σ is the population standard deviation
- n is the sample size
Hypothesis are of two kinds. Null hypothesis (H0): The statement of no effect or no difference in test statistic. It is denoted as H0. Alternative hypothesis (Hα or H1): The alternate statement to the null hypothesis is the alternative hypothesis, which means a statement that represents the effect and difference in the test. It’s denoted as Hα or H1.
To proceed with any process, it’s important to know the significant level of the critical value first, by using the formula:
Significant level = (Alpha) α = 1 – confidence level / 100
Where α represents the significant level. The confidence level will give with the given condition, sometimes it’s not so we can assume as ourselves, such as (95% or something else).
It is important to note that hypothesis testing involves the risk of making mistakes. A Type-I error occurs when the null hypothesis is incorrectly rejected, and a Type-II error occurs when the null hypothesis is incorrectly accepted.
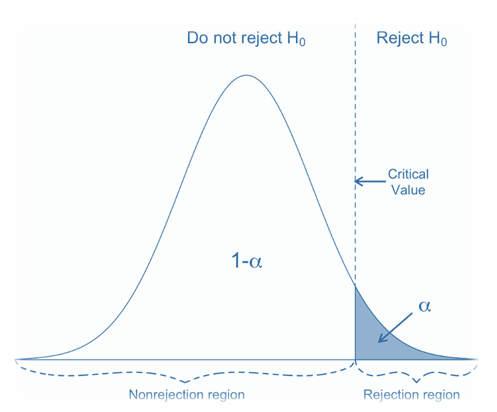
(1) Right-tailed test: A right-tailed test has the right-side rejection region of the null hypothesis. The whole probability α goes to the right side of the region.
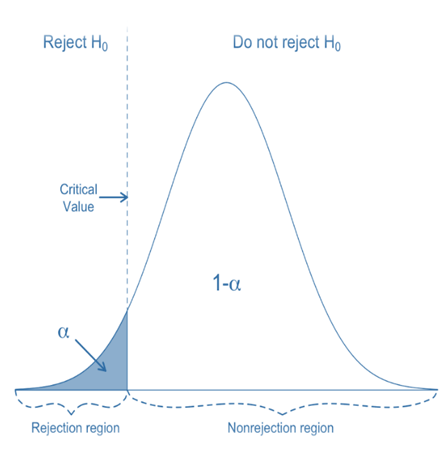
(2) Left-tailed test: A left-tailed test has the left-side rejection of the null hypothesis. The whole probability α goes to the left side of the region.
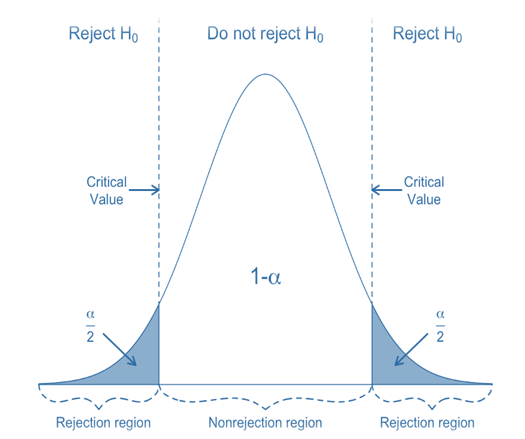
(3) Two-tailed test: A two-tailed test has two different rejection regions of the null hypothesis. Each rejection region has the same probability of α/2. The range of the non-rejection hypothesis is 1 – α.
(4) Z-Critical value: When testing a hypothesis, the Z-critical value helps determine whether a sample statistic is statistically significant or within the expected value.
Used when the sample size is 30 or more and the population standard deviation is specified.
It is associated with a certain level of importance or credibility.
Steps to find the z critical value.
- Compute the significance level (α).
- Compute the type of test:
- For a right-tailed test: Subtract α from 0.5
- For left-sided tests: Subtract the α value from 1.
- For a two-tailed test: Subtract α/2 from 1.
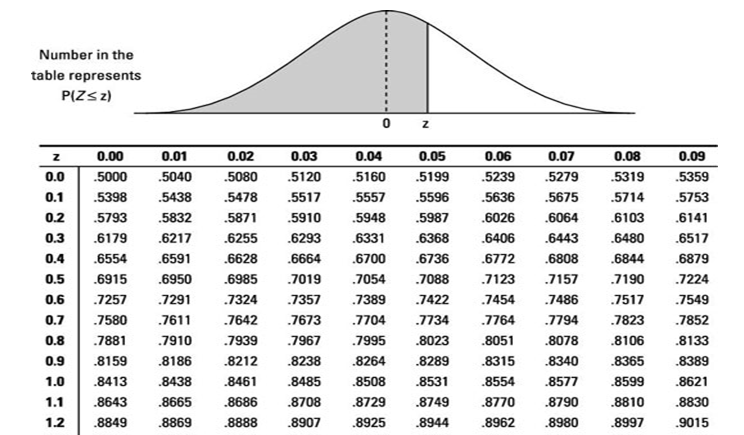
- Determine the resulting value by using the Z table.
- Find the Z-critical value by summing the values in the intersecting row (top) and column (far left).
- Once you find the left-hand test, be sure to use the negative Z critical symbol in your calculations.
Use the following Z-distribution table to find the critical value.

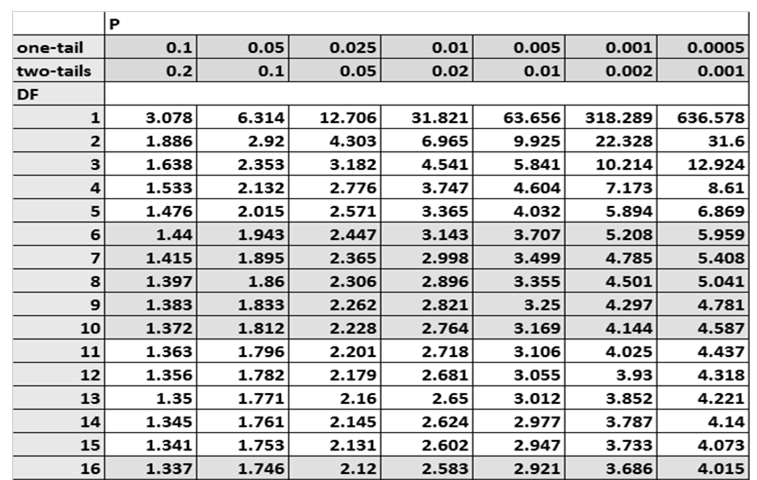
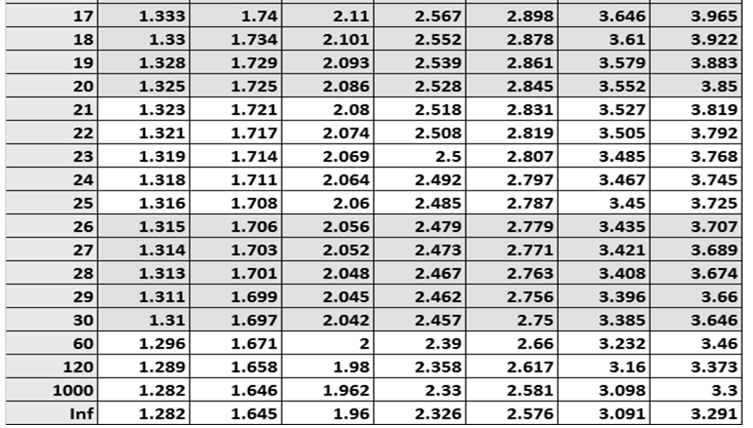
(5) T-Critical Value: The t-critical value test is the statistical method used to determine the boundaries in a t-distribution which is the null hypothesis is rejected. By using the following steps, we can find the t-critical value.
- Compute α value.
- Find the degrees of freedom (df). Typically, for a sample of size n in a t-distribution, there are n – 1 degrees of freedom.
- Calculate the t-critical value.
- If the hypothesis test is one-sided, use a one-tailed t-distribution table.
- For two-tailed tests, use the two-tailed t-distribution table.
- See the distribution table at degrees of freedom in the left column and the significance level in the top row. Find the significant t-values where the rows and columns in the table intersect.
- Find the significant t-values where the rows and columns in the table intersect.
Use the following t-distribution table to find the critical point.
(6) Chi-Square Test: Use the chi-square test to determine whether the sample data and population data match. If two variables are related, they can also be compared using this method. The critical chi-square value is given as
- Compute the alpha value.
- Compute the degrees of freedom (df) by subtracting 1 from the sample size (n – 1).
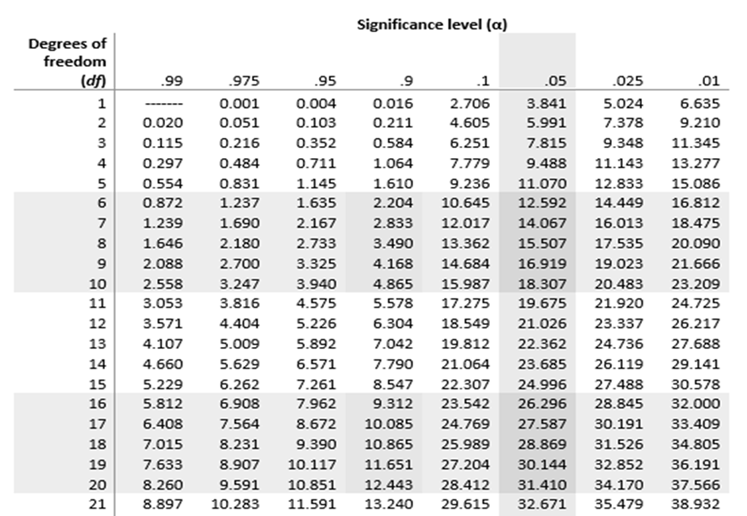
- Using a chi-square distribution table, the intersection of the row of degrees of freedom and the column of alpha values determines the critical chi-square value.
The chi-square test statistic:

Where,
- Χ2 is the Chi-square Obtained
- O is the Observed score
- E is the expected value
- Σ is the sum
Use the following chi-square distribution table to find the critical point.

Solved Example:
| The following example helps you to estimate the critical values. Find the critical value for the two-sided test contained on the following samples at α = 0.03, variance 1 = 116, variance 2 = 90, sample 1 = 41, sample 2 = 19 Solution: Sample 1 = n1 = 41 Sample 2 = n2 = 19 Find the degree of freedom (df) = n1 – 1 = 40 and n2 – 1 = 18 Using the distribution table for α = 0.03, the value at the intersection of the 40th column and 18th row is f(40,18) = 2.11 The critical value = 2.11 |
Wrap Up:
This article contains deep information about the critical values in statistics subject. We have discussed hypothesis testing to find a critical value which is the main term for the critical point and knowing the solving methods of hypothesis testing step-by-step. In the end, an example can help you to understand the concept of the topic and teach you how it is used.





Comments (No)