Graphical Solution of Trigonometric Equation:
Trigonometric equations can also be solved graphically as in the case of algebraic equations. The steps for graphical solution are-
(1) The two graphs for the two expressions on the two sides of the equation are drawn on the same sheet of paper or on the same graph paper.
(2) The points of intersection of the two graphs are then determined carefully. The points of intersection of the two graphs give the required solution.
Alternative Method:
(1) All the terms of the given equation are transposed to the left-hand side so as to get zero on the right-hand side.
(2) The graph of the expression on the left-hand side is drawn.
(3) The abscissae of the points where the graph intersects the X-axis are determined. The values of x thus obtained are the solutions of the given equation.
Example: Solve graphically the equation 2 sin2 x = cos 2x between x = -π/2 to x = π.
Solution: The values of y = 2 sin2 x and y = cos 2x for different values of x in the interval -π/2 ≤ x ≤ π are shown in the table below.
| x (in radians) | sin2 x | cos 2x |
|---|---|---|
| -π/2 | 1.00 | -1.00 |
| -π/3 | 0.75 | -0.50 |
| -π/4 | 0.50 | 0 |
| -π/6 | 0.25 | 0.50 |
| 0 | 0 | 1 |
| π/6 | 0.25 | 0.50 |
| π/4 | 0.50 | 0 |
| π/3 | 0.75 | -0.50 |
| π/2 | 1 | -1 |
| 2π/3 | 0.75 | -0.50 |
| 3π/4 | 0.50 | 0 |
| 3π/6 | 0.25 | 0.50 |
| π | 0 | 1.00 |
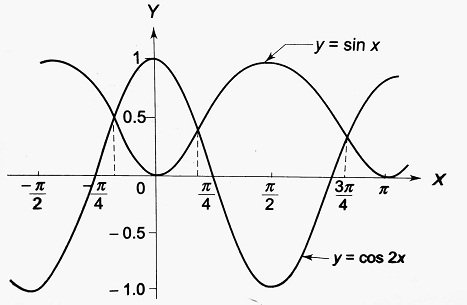
The two graphs are drawn on the same sheet of paper taking the same axes and on the same scale. The graphs are shown below.

From the graph, the abscissa of the points of intersection is found to be -π/6, π/6 and 5π/6. Thus, the solutions are x = -π/6, π/6 and 5π/6.


Comments (No)