Acid-Base Titrations:
In these types of titrations, the overall reaction involved is a neutralization reaction i.e.,
| H+ + OH– ——-> H2O |
For example, let us titrate a solution of HCl against NaOH. Any electrode whose potential depends upon H+ ion concentration example- A hydrogen electrode is placed in HCl Solution. It is connected to a reference electrode (for example Calomel electrode) to form a galvanic cell. The galvanic cell representation is-
| Pt, H2, H+ (C = unknown) // KCl (sat. sol.) / Hg2 Cl2 / Hg |
The EMF of the cell is-
| E = Ecathode – Eanode E = 0.2422 – 0.0591 log [H+] E = 0.2422 + 0.0591 pH |
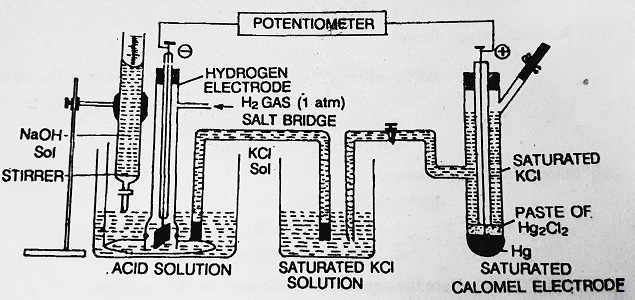
Suppose 100 ml of 0.1M HCl is to be titrated against 1M NaOH (titrant- means taken in a burette). The concentration of titrant should be 5 to 10 times more than that of the solution to be titrated so that the volume change is as small as possible. As the titration proceeds, the H+ ions concentration in the solution goes on decreasing i.e., the pH of the solution goes on increasing, and the EMF of a cell also increases according to the above equation.
If we assume that, for the sake of simplicity of the equation, there is no change in volume during the titration with the addition of the first 9 ml of NaOH solution will give a change of 0.0591 V with the addition of the next 0.09 ml will also produce the same change. Thus, the EMF of the cell changes slowly at first but more and more rapidly as the endpoint approaches. After the endpoint, further addition of NaOH produces very little change in the H+ ion concentration. Hence there is very little change in the EMF of the cell.
A plot of EMF against the volume of NaOH added is shown the EMF of a cell initially rises gradually and thereafter more rapidly near the equivalence point. Beyond the equivalence point, the EMF of the cell again increases slightly upon adding more of NaOH.
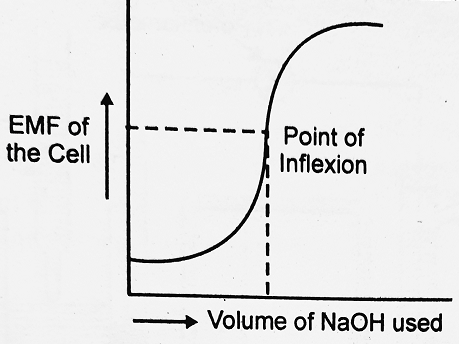
For a reaction, that goes to completion, the titration curve is so steep near the equivalence point that the uncertainty is small. The equivalence point can not be determined exactly.
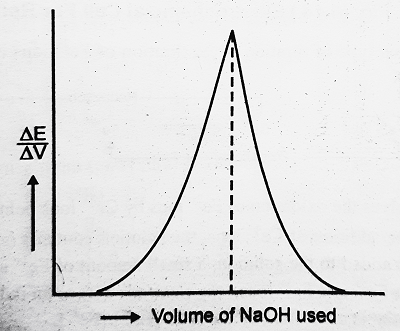
This plot shows that the slope of the titration curve that is formed by the change in EMF with a change in volume against the volume of NaOH is drawn with the completion of the reaction, the sharper the peak and hence more accurate is the location of the equivalence point.






Comments (No)